

Unsupervised Analysis Project
Overview
Apple and Windows is a time-sized rivalry. It has always been a growing dilemma for a customer to make choices with each getting their own share of loyalists and critic, advantages and contrast. This question applies to producers who realize what makes that person purchase their goods and even more so who exactly purchases their goods. With demographic segmentation as a past, we plan to gather a detailed grasp of the purchasing behavior of customers who choose one over the other in the following studies. The three key drivers of purchasing are personal (demographic), psychological (psychographic or psychometric) and social (external stimuli).The research focuses on more intrinsic variables such as demographics and customer psychography. The collection of data is primary from an online survey. Considering that this is a consumer survey with limitations including lack of interest, misperception and dishonest responses at the end of a long survey. Psychology helping us understand the motives, actions, emotions and cognition of an individual. We can look at demographics gathered while reviewing the data collection. The psychographics of consumers are effectively known. The survey used Big 5 as well as Hult DNA, to determine the behavior.
Big 5 The Big 5 Personality, also called OCEAN, allows us to understand the degree to which customers use:
- Openness
- Conscientousness
- Extraversion
- Agreeableness
- Neuroticism This will help us understand the behaviour of the student.
Hult DNA For a student to be employable in graduation, nine years of study at the Hult facilities have resulted in a must-do approach. Within its students Hult frequently absorbs them.The Hult DNA consists of 3 broad categories and 3 subcategories within each category, namely:
- Thinking
Shows self-awareness Embraces change Demonstrates dynamic thinking
2.Communicating
Speaks and listens confidentally Influences confidentally Presents ideas effectively
3.Team Building
Fosters collaborative relationships Influences productivity Resolves conflict constructively This helps us to understand the student’s psychometrics.
##Dataset Analysis There are 137 students in the survey dataset, 78 questions based on psychological and 7 questions on demographic. 50 questions related to Big5 and 18 questions related to Hult-DNA. 69 students have Macbook and 68 students have Windows. 77 students want Macbook and 68 students want Windows next year and 4 students to Chromebook. Total of 23 students want to change their laptop from which 17 students moving from windows to macbook and only 6 students from macbook to windows. Out of 78 male students, 15 of them are changing their laptop and 8 female students out of 59 want to change their laptop.
Importing Packages
import sys                      # system-specific parameters and functions
import pandas as pd # data science essentials
import seaborn as sns# essential graphical output
import matplotlib.pyplot as plt # enhanced graphical output
import numpy as np # mathematical essentials
import statsmodels.formula.api as smf # regression modeling
from sklearn.decomposition import PCA            # pca
from sklearn.datasets      import load_digits    # digits dataset
from sklearn.manifold      import TSNE           # t-SNE
from sklearn.preprocessing import StandardScaler # standard scaler
import matplotlib
from scipy.cluster.hierarchy import dendrogram, linkage # dendrograms
from sklearn.cluster         import KMeans

# reading the file into Python
team_df = pd.read_excel('./survey_data.xlsx')

#lowering case of the column names
#team_df.columns = map(str.lower, team_df.columns)

########################################
# loading data and setting display options
########################################
# loading data
digits = load_digits()

# setting print options
pd.set_option('display.max_rows', 500)
pd.set_option('display.max_columns', 500)
pd.set_option('display.width', 1000)
pd.set_option('display.max_colwidth', 100)
pd.np.set_printoptions(threshold=sys.maxsize)

########################################
# chacking the type of the dataset
########################################
type(digits)
Changing column names We will start with data cleaning and creation of new variables for our analysis
#Creating a new list with the new names for each column
col_dict = {
    "surveyID": "survey_ID_num",
    "Am the life of the party": "life_of_party",
    "Feel little concern for others": "concern_others",
    "Am always prepared": "always_prepared",
    "Get stressed out easily": "stressed_easily",
    "Start conversations":"start_conversations",
    "Have a rich vocabulary": "rich_vocabulary",
    "Don't talk a lot": "do_not_talk",
    "Am interested in people": "int_people",
    "Leave my belongings around":"leave_belong_around",
    "Am relaxed most of the time":"relax_most_time",
    "Have difficulty understanding abstract ideas":"diff_und_abstract",
    "Feel comfortable around people":"conf_with_people",
    "Insult people":"insult_people",
    "Pay attention to details":"attention_details",
    "Worry about things":"worry_things",
    "Have a vivid imagination":"vivind_immag",
    "Keep in the background":"keep_background",
    "Sympathize with others' feelings":"symp_others",
    "Make a mess of things":"make_mess",
    "Seldom feel blue":"seldon_feel_blue",
    "Am not interested in abstract ideas":"uninterested_abstract_ideas",
    "Am not interested in other people's problems":"uncurious_about_people_problems",
    "Get chores done right away":"chores_done_right_away",
    "Am easily disturbed":"easily_disturbed",
    "Have excellent ideas":"have_excellent_ideas",
    "Have little to say":"have_little_to_say",
    "Have a soft heart":"soft_hearted",
    "Often forget to put things back in their proper place":"forget_to_place_back_inorder",
    "Get upset easily":"get_upset_easily",
    "Do not have a good imagination":"bad_imagination",
    "Talk to a lot of different people at parties":"social_at_parties",
    "Am not really interested in others":"not_intrested_in_others",
    "Like order":"like_order",
    "Change my mood a lot":"frequent_mood_change",
    "Am quick to understand things":"fast_learner",
    "Don't like to draw attention to myself":"reticent_person",
    "Take time out for others":"gives_time_for_others",
    "Shirk my duties":"shrik_my_duties",
    "Have frequent mood swings":"frequent_mood_swings",
    "Use difficult words":"use_difficult_words",
    "Don't mind being the center of attention":"center_of_attention",
    "Feel others' emotions":"feel_others_emotions",
    "Follow a schedule":"follows_schedule",
    "Get irritated easily":"mad_easily",
    "Spend time reflecting on things":"spend_time_reflecting",
    "Am quiet around strangers": "quiet_with_strangers",
    "Make people feel at ease":"make_people_feel_ease",
    "Am exacting in my work":"exact_in_work",
    "Often feel blue":"often_feel_blue",
    "Am full of ideas":"full_of_ideas",
    "See underlying patterns in complex situations":"answers_complex_situations",
    "Don't  generate ideas that are new and different":"dont_create_new_ideas",
    "Demonstrate an awareness of personal strengths and limitations":"self_awareness",
    "Display a growth mindset":"growth_mindset",
    "Respond effectively to multiple priorities":"respond_effectively_1",
    "Take initiative even when circumstances, objectives, or rules aren't clear":"takes_initiative_1",
    "Encourage direct and open discussions":"encourage_open_discussions_1",
    "Respond effectively to multiple priorities.1": "respond_effectively_2",
    "Take initiative even when circumstances, objectives, or rules aren't clear.1":"takes_initiative_2",
    "Encourage direct and open discussions.1":"encourage_open_discussions_2",
    "Listen carefully to others":"listen_others",
    "Don't persuasively sell a vision or idea":"dont_sell_idea",
    "Build cooperative relationships": "build_coop_rel",
    "Work well with people from diverse cultural backgrounds": "work_diverse_cult",
    "Effectively negotiate interests, resources, and roles": "effect_negotiate",
    "Can't rally people on the team around a common goal": "cant_rally",
    "Translate ideas into plans that are organized and realistic": "translate_ideas_to_plans",
    "Resolve conflicts constructively": "resolve_conflicts",
    "Seek and use feedback from teammates": "seek_use_feedback",
    "Coach teammates for performance and growth": "coach_for_perf_growth",
    "Drive for results": "drive_for_results",
    "What laptop do you currently have?": "current_laptop",
    "What laptop would you buy in next assuming if all laptops cost the same?": "next_laptop",
    "What program are you in?": "program",
    "What is your age?": "age",
    "Gender": "gender",
    "What is your nationality? ": "nationality",
    "What is your ethnicity?": "ethnicity"
}
#Assigning the names to the columns
team_df.columns = team_df.columns.map(col_dict)
Merging similar columns
#Creating new columns by adding the ones that were repeated in the dataset
team_df['respond_effectively_3']  = (team_df['respond_effectively_1']+team_df['respond_effectively_2'])/2
team_df['takes_initiative_3']  = (team_df['takes_initiative_1']+team_df['takes_initiative_2'])/2
team_df['encourage_open_discussions_3']  = (team_df['encourage_open_discussions_1']+team_df['encourage_open_discussions_2'])/2
#Creating a loop to assign these values to the column respond effectively
team_df['respond_effectively']   = 0

for index, value in team_df.iterrows():


    if team_df.loc[index, 'respond_effectively_3'] >= 0 and team_df.loc[index, 'respond_effectively_3'] < 1:
        team_df.loc[index, 'respond_effectively'] = 0

    if team_df.loc[index, 'respond_effectively_3'] >= 1 and team_df.loc[index, 'respond_effectively_3'] < 2:
        team_df.loc[index, 'respond_effectively'] = 1

    if team_df.loc[index, 'respond_effectively_3'] >= 2 and team_df.loc[index, 'respond_effectively_3'] < 3:
        team_df.loc[index, 'respond_effectively'] = 2

    if team_df.loc[index, 'respond_effectively_3'] >= 3 and team_df.loc[index, 'respond_effectively_3'] < 4:
        team_df.loc[index, 'respond_effectively'] = 3

    if team_df.loc[index, 'respond_effectively_3'] >= 4 and team_df.loc[index, 'respond_effectively_3'] < 5:
        team_df.loc[index, 'respond_effectively'] = 4

    if team_df.loc[index, 'respond_effectively_3'] == 5:
        team_df.loc[index, 'respond_effectively'] = 5
#Creating a loop to assign these values to the column takes initiative
team_df['takes_initiative']   = 0

for index, value in team_df.iterrows():


    if team_df.loc[index, 'takes_initiative_3'] >= 0 and team_df.loc[index, 'takes_initiative_3'] < 1:
        team_df.loc[index, 'takes_initiative'] = 0

    if team_df.loc[index, 'takes_initiative_3'] >= 1 and team_df.loc[index, 'takes_initiative_3'] < 2:
        team_df.loc[index, 'takes_initiative'] = 1

    if team_df.loc[index, 'takes_initiative_3'] >= 2 and team_df.loc[index, 'takes_initiative_3'] < 3:
        team_df.loc[index, 'takes_initiative'] = 2

    if team_df.loc[index, 'takes_initiative_3'] >= 3 and team_df.loc[index, 'takes_initiative_3'] < 4:
        team_df.loc[index, 'takes_initiative'] = 3

    if team_df.loc[index, 'takes_initiative_3'] >= 4 and team_df.loc[index, 'takes_initiative_3'] < 5:
        team_df.loc[index, 'takes_initiative'] = 4

    if team_df.loc[index, 'takes_initiative_3'] == 5:
        team_df.loc[index, 'takes_initiative'] = 5
#Creating a loop to assign these values to the column encourage open discussions
team_df['encourage_open_discussions']   = 0

for index, value in team_df.iterrows():


    if team_df.loc[index, 'encourage_open_discussions_3'] >= 0 and team_df.loc[index, 'encourage_open_discussions_3'] < 1:
        team_df.loc[index, 'encourage_open_discussions'] = 0

    if team_df.loc[index, 'encourage_open_discussions_3'] >= 1 and team_df.loc[index, 'encourage_open_discussions_3'] < 2:
        team_df.loc[index, 'encourage_open_discussions'] = 1

    if team_df.loc[index, 'encourage_open_discussions_3'] >= 2 and team_df.loc[index, 'encourage_open_discussions_3'] < 3:
        team_df.loc[index, 'encourage_open_discussions'] = 2

    if team_df.loc[index, 'encourage_open_discussions_3'] >= 3 and team_df.loc[index, 'encourage_open_discussions_3'] < 4:
        team_df.loc[index, 'encourage_open_discussions'] = 3

    if team_df.loc[index, 'encourage_open_discussions_3'] >= 4 and team_df.loc[index, 'encourage_open_discussions_3'] < 5:
        team_df.loc[index, 'encourage_open_discussions'] = 4

    if team_df.loc[index, 'encourage_open_discussions_3'] == 5:
        team_df.loc[index, 'encourage_open_discussions'] = 5
#Creating a loop to group age into a corresponding category
team_df['age_group']   = 0

for index, value in team_df.iterrows():


    if team_df.loc[index, 'age'] >= 21 and team_df.loc[index, 'age'] <= 29:
        team_df.loc[index, 'age_group'] = 'twenties'

    if team_df.loc[index, 'age'] >= 30 and team_df.loc[index, 'age'] <= 39:
        team_df.loc[index, 'age_group'] = 'thirties'

    if team_df.loc[index, 'age'] >= 40 and team_df.loc[index, 'age'] <= 49:
        team_df.loc[index, 'age_group'] = 'forties'
#Creating a list to clean the nationalities and have them in the same format
group_nationalities = {"Indian" : "Indian",
                       "China": "Chinese",
                       "German": "German",
                       "Mexican": "Mexican",
                      "Peruvian": "Peruvian",
                      "Taiwan": "Taiwanese",
                      "American": "American",
                      "Chinese": "Chinese",
                      "USA" : "American",
                      "Brazilian" : "Brazilian",
                      "Norwegian" : "Norwegian",
                      "Russian" : "Russian",
                      "Colombian" : "Colombian",
                      "Turkish" : "Turkish",
                      "Nigerian" : "Nigerian",
                      "Vietnamese" : "Vietnamese",
                      "Republic of Korea" : "South Korean",
                      "Indonesian" : "Indonesian",
                      "Italian" : "Italian",
                      "Thai": "Thai",
                      "Russia" : "Russian",
                      "indian" : "Indian",
                      "Brazil" : "Brazilian",
                      "British" : "British",
                      "Mauritius" : "Mauritian",
                      "chinese" : "Chinese",
                      "colombian" : "Colombian",
                      "German/American" : "Multi-ethnic",
                      "Costarrican" : "Costarrican",
                      "Nigeria" : "Nigerian",
                      "Germany" : "German",
                      "Japan" : "Japanese",
                      "Czech" : "Czech",
                      "mexican" : "Mexican",
                      "canadian" : "Canadian",
                      "Kenyan" : "Kenyan",
                      "Ghanaian" : "Ghanaian",
                      "Belgian " : "Belgian",
                      "INDIAN" : "Indian",
                      "Indonesia" : "Indonesian",
                      "Philippines" : "Filipino",
                      "Ecuador" : "Ecuadorian",
                      "Ugandan" : "Ugandan",
                      "Korea" : "South Korean",
                      "Spain": "Spanish",
                      "Canada" : "Canadian",
                      "Italian and Spanish" : "Multi-ethnic",
                      "South Korea" : "South Korean",
                      "prefer not to answer" : "Prefer not to answer",
                      "china": "Chinese",
                      "peru": "Peruvian",
                      "Swiss": "Swiss",
                      "Portuguese" : "Portuguese",
                      "Belarus": "Belarusians",
                      "Ukrainian": "Ukrainian",
                      "ecuador" : "Ecuadorian",
                      "Dominican " : "Dominican",
                      "Congolese" : "Congolese",
                      "nigerian": "Nigerian",
                      "Pakistani": "Pakistani",
                      "Ecuadorian" : "Ecuadorian",
                      "italian": "Italian",
                      "Dominican" : "Dominican",
                      "indian." : "Indian",
                      "Venezuelan": "Venezuelan",
                      "CHINA" : "Chinese",
                      "British, Indian" : "Multi-ethnic",
                      "Kyrgyz" : "Kyrgyz",
                      "Spanish" : "Spanish",
                      "Panama" : "Panamanians",
                      "Colombia" : "Colombian",
                      "Filipino " : "Filipino",
                      "Congolese (DR CONGO)" : "Congolese",
                      "Czech Republic" : "Czech",
                      "Peru" : "Peruvian"}

#Assigning the names to the nationality column
team_df['nationality'].replace(group_nationalities, inplace = True)

team_df['nationality'].value_counts()
#Creating a list to group the nationalities into different countries
mapping = {"Indian": "Asia",
           "Chinese": "Asia",
           "Taiwanese": "Asia",
       "Vietnamese": "Asia",
           "South Korean": "Asia",
           "Indonesian": "Asia",
       "Thai": "Asia",
           "Japanese": "Asia",
           "Pakistani": "Asia",
           "Kyrgyz": "Asia",
           "Filipino": "Asia",
           "Filipino1": "Asia",
           "Mauritian" : "Africa",
           "Nigerian": "Africa",
           "Kenyan": "Africa",
           "Ghanaian": "Africa",
           "Congolese": "Africa",
           "Ugandan": "Africa",
           "Mexican": "North_America",
           "American": "North_America",
           "Canadian": "North_America",
           "Dominican": "North_America",
           "Costarrican": "North_America",
           "Panamanians": "North_America",
           "Dominican1": "North_America",
           "Peruvian": "South_America",
           "Brazilian": "South_America",
           "Colombian": "South_America",
           "Ecuadorian": "South_America",
           "Venezuelan": "South_America",
           "German": "Europe",
           "Norwegian": "Europe",
           "Russian": "Europe",
           "Turkish": "Europe",
           "Italian": "Europe",
           "British": "Europe",
           "Czech": "Europe",
           "Belgian": "Europe",
           "Portuguese": "Europe",
           "Spanish": "Europe",
           "Swiss": "Europe",
           "Belarusians": "Europe",
           "Ukrainian": "Europe",
           "Multi-ethnic": "Others",
           "Prefer not to answer": "Others"}

#Assigning the nationalities to the new column created
team_df['country_mapped'] = team_df.nationality.map(mapping)
#Creating new variables by making a comparison of people that can switch laptop model
team_df['change_laptop']   = 0

for index, value in team_df.iterrows():


    if team_df.loc[index, 'current_laptop'] == 'Macbook' and team_df.loc[index, 'next_laptop'] == 'Macbook' :
        team_df.loc[index, 'change_laptop'] = 'no_change'

    if team_df.loc[index, 'current_laptop'] == 'Macbook' and team_df.loc[index, 'next_laptop'] == 'Windows laptop' :
        team_df.loc[index, 'change_laptop'] = 'change_of_laptop'

    if team_df.loc[index, 'current_laptop'] == 'Macbook' and team_df.loc[index, 'next_laptop'] == 'Chromebook' :
        team_df.loc[index, 'change_laptop'] = 'change_of_laptop'

    if team_df.loc[index, 'current_laptop'] == 'Windows laptop' and team_df.loc[index, 'next_laptop'] == 'Windows laptop' :
        team_df.loc[index, 'change_laptop'] = 'no_change'

    if team_df.loc[index, 'current_laptop'] == 'Windows laptop' and team_df.loc[index, 'next_laptop'] == 'Macbook':
        team_df.loc[index, 'change_laptop'] = 'change_of_laptop'

    if team_df.loc[index, 'current_laptop'] == 'Windows laptop' and team_df.loc[index, 'next_laptop'] == 'Chromebook' :
        team_df.loc[index, 'change_laptop'] = 'change_of_laptop'
#Creating a new variable to see Apples loyalty customers
team_df['apple_target']   = 0

for index, value in team_df.iterrows():


    if team_df.loc[index, 'current_laptop'] == 'Macbook' and team_df.loc[index, 'next_laptop'] == 'Macbook' :
        team_df.loc[index, 'apple_target'] = 'customer_genuine'

    if team_df.loc[index, 'current_laptop'] == 'Macbook' and team_df.loc[index, 'next_laptop'] == 'Windows laptop' :
        team_df.loc[index, 'apple_target'] = 'customer_loss'

    if team_df.loc[index, 'current_laptop'] == 'Macbook' and team_df.loc[index, 'next_laptop'] == 'Chromebook' :
        team_df.loc[index, 'apple_target'] = 'customer_loss'

    if team_df.loc[index, 'current_laptop'] == 'Windows laptop' and team_df.loc[index, 'next_laptop'] == 'Windows laptop' :
        team_df.loc[index, 'apple_target'] = 'target_customer'

    if team_df.loc[index, 'current_laptop'] == 'Windows laptop' and team_df.loc[index, 'next_laptop'] == 'Macbook':
        team_df.loc[index, 'apple_target'] = 'customer_gain'

    if team_df.loc[index, 'current_laptop'] == 'Windows laptop' and team_df.loc[index, 'next_laptop'] == 'Chromebook' :
        team_df.loc[index, 'apple_target'] = 'target_customer'
#Creating a new variable to compare the change of laptop and gender
team_df['change_gender']   = 0

for index, value in team_df.iterrows():


    if team_df.loc[index, 'change_laptop'] == 'change_of_laptop' and team_df.loc[index, 'gender'] == 'Male' :
        team_df.loc[index, 'change_gender'] = 1

    if team_df.loc[index, 'change_laptop'] == 'change_of_laptop' and team_df.loc[index, 'gender'] == 'Female' :
        team_df.loc[index, 'change_gender'] = 2

    if team_df.loc[index, 'change_laptop'] == 'no_change':
        team_df.loc[index, 'change_gender'] = 0
#Creating a new variable to compare the change of laptop and age
team_df['change_age']   = 0

for index, value in team_df.iterrows():


    if team_df.loc[index, 'change_laptop'] == 'change_of_laptop' and team_df.loc[index, 'age_group'] == 'twenties' :
        team_df.loc[index, 'change_age'] = 1

    if team_df.loc[index, 'change_laptop'] == 'change_of_laptop' and team_df.loc[index, 'age_group'] == 'thirties' :
        team_df.loc[index, 'change_age'] = 2

    if team_df.loc[index, 'change_laptop'] == 'change_of_laptop' and team_df.loc[index, 'age_group'] == 'forties' :
        team_df.loc[index, 'change_age'] = 3

    if team_df.loc[index, 'change_laptop'] == 'no_change':
        team_df.loc[index, 'change_age'] = 0
#Creating a new variable to compare the change of laptop and the program
team_df['change_degree']   = 0

for index, value in team_df.iterrows():


    if team_df.loc[index, 'change_laptop'] == 'change_of_laptop' and team_df.loc[index, 'program'] == 'DD (MIB & Business Analytics)' :
        team_df.loc[index, 'change_degree'] = 1

    if team_df.loc[index, 'change_laptop'] == 'change_of_laptop' and team_df.loc[index, 'program'] == 'One year Business Analytics' :
        team_df.loc[index, 'change_degree'] = 2

    if team_df.loc[index, 'change_laptop'] == 'change_of_laptop' and team_df.loc[index, 'program'] == 'DD (MBA & Business Analytics)':
        team_df.loc[index, 'change_degree'] = 3

    if team_df.loc[index, 'change_laptop'] == 'change_of_laptop' and team_df.loc[index, 'program'] == 'DD (MBA & Disruptive innovation)':
        team_df.loc[index, 'change_degree'] = 4

    if team_df.loc[index, 'change_laptop'] == 'no_change':
        team_df.loc[index, 'change_degree'] = 0
Dropping columns not required
 #Creating a new variable to compare the change of laptop and the program
team_df['change_degree']   = 0

for index, value in team_df.iterrows():


    if team_df.loc[index, 'change_laptop'] == 'change_of_laptop' and team_df.loc[index, 'program'] == 'DD (MIB & Business Analytics)' :
        team_df.loc[index, 'change_degree'] = 1

    if team_df.loc[index, 'change_laptop'] == 'change_of_laptop' and team_df.loc[index, 'program'] == 'One year Business Analytics' :
        team_df.loc[index, 'change_degree'] = 2

    if team_df.loc[index, 'change_laptop'] == 'change_of_laptop' and team_df.loc[index, 'program'] == 'DD (MBA & Business Analytics)':
        team_df.loc[index, 'change_degree'] = 3

    if team_df.loc[index, 'change_laptop'] == 'change_of_laptop' and team_df.loc[index, 'program'] == 'DD (MBA & Disruptive innovation)':
        team_df.loc[index, 'change_degree'] = 4

    if team_df.loc[index, 'change_laptop'] == 'no_change':
        team_df.loc[index, 'change_degree'] = 0
#lowering case of the column names
team_df.columns = map(str.lower, team_df.columns)

# checking information about each column
team_df.head(5)
##BIg5 Dataset We start subsetting the dataset to first analyze the columns that correspond to the Big 5
#Subsetting the data only taking into consideration the variables used for the analysis of the big 5
df_big5 = team_df.drop(['survey_id_num', 'current_laptop','next_laptop',
                            'program','gender', 'nationality', 'ethnicity','age_group',
                            'respond_effectively','takes_initiative','encourage_open_discussions',
                            'answers_complex_situations','dont_create_new_ideas','self_awareness',
                            'growth_mindset','listen_others','dont_sell_idea','build_coop_rel',
                            'work_diverse_cult','effect_negotiate','cant_rally','translate_ideas_to_plans',
                            'resolve_conflicts','seek_use_feedback','coach_for_perf_growth','drive_for_results',
                           'change_laptop','change_degree','change_age','change_gender','apple_target','country_mapped'],
                             axis = 1)
#Creating a list of variables that need to be inverted
big5_inverted = ['uninterested_abstract_ideas',
'bad_imagination',
'leave_belong_around',
'make_mess',
'forget_to_place_back_inorder',
'shrik_my_duties',
'do_not_talk',
'keep_background',
'have_little_to_say',
'reticent_person',
'quiet_with_strangers',
'not_intrested_in_others',
'insult_people',
'uncurious_about_people_problems',
'concern_others']
#Inverting the numbers for the variables in the list
big5_df = df_big5.copy()
for col in big5_inverted:
    for i, cols in big5_df.iterrows():
        if big5_df.loc[i,col] == 1:
            big5_df.loc[i,col] = 5
        elif big5_df.loc[i,col] == 2:
            big5_df.loc[i,col] = 4
        elif big5_df.loc[i,col] == 4:
            big5_df.loc[i,col] = 2
        elif big5_df.loc[i,col] == 5:
            big5_df.loc[i,col] = 1
#Grouping the columns that represent the extraversion behavior
extraversion_questions = ['life_of_party','do_not_talk','conf_with_people','keep_background','start_conversations',
'have_little_to_say','social_at_parties','reticent_person','center_of_attention',
'quiet_with_strangers']
big5_df['Extraversion'] = 0
for i in extraversion_questions:
    big5_df['Extraversion'] = big5_df['Extraversion'] + big5_df.loc[:,i]
#Grouping the columns that represent the agreeableness behavior
agreeableness_questions = ['concern_others','int_people','insult_people','symp_others','uncurious_about_people_problems',
'soft_hearted','not_intrested_in_others','gives_time_for_others','feel_others_emotions',
'make_people_feel_ease']
big5_df['Agreeableness'] = 0
for i in agreeableness_questions:
    big5_df['Agreeableness'] = big5_df['Agreeableness'] + big5_df.loc[:,i]
#Grouping the columns that represent the conscientiousness behavior
conscientiousness_questions = ['always_prepared','leave_belong_around','attention_details','make_mess',
'chores_done_right_away','forget_to_place_back_inorder', 'like_order','shrik_my_duties',
'follows_schedule','exact_in_work']
big5_df['Conscientiousness'] = 0
for i in conscientiousness_questions:
    big5_df['Conscientiousness'] = big5_df['Conscientiousness'] + big5_df.loc[:,i]
#Grouping the columns that represent the neuroticism behavior
neuroticism_questions = ['stressed_easily','relax_most_time','worry_things','seldon_feel_blue','easily_disturbed',
'get_upset_easily','frequent_mood_change','frequent_mood_swings','mad_easily',
'often_feel_blue']
big5_df['Neuroticism'] = 0
for i in neuroticism_questions:
    big5_df['Neuroticism'] = big5_df['Neuroticism'] + big5_df.loc[:,i]
#Grouping the columns that represent the openness behavior
openness_questions = ['rich_vocabulary','diff_und_abstract','vivind_immag','uninterested_abstract_ideas',
'have_excellent_ideas', 'bad_imagination','fast_learner','use_difficult_words',
'spend_time_reflecting','full_of_ideas']
big5_df['Openness'] = 0
for i in openness_questions:
    big5_df['Openness'] = big5_df['Openness'] + big5_df.loc[:,i]

# Creating new dataset
big5_df = big5_df[['Extraversion',
                               'Agreeableness',
                               'Conscientiousness',
                               'Neuroticism',
                               'Openness']]
Big5 Scaling
# INSTANTIATING a StandardScaler() object
scaler = StandardScaler()


# FITTING the scaler with the data
scaler.fit(big5_df)


# TRANSFORMING our data after fit
X_scaled = scaler.transform(big5_df)


# converting scaled data into a DataFrame
big5_scaled = pd.DataFrame(X_scaled)


# reattaching column names
big5_scaled.columns = big5_df.columns


# checking pre- and post-scaling variance
print(pd.np.var(big5_df),'\n\n')
print(pd.np.var(big5_scaled))
Extraversion 43.033300 Agreeableness 31.442059 Conscientiousness 30.336619 Neuroticism 35.998082 Openness 19.426821 dtype: float64
Extraversion 1.0 Agreeableness 1.0 Conscientiousness 1.0 Neuroticism 1.0 Openness 1.0 dtype: float64
#Creating a correlation matrix to check if we have enough variance in our dataset to be able to continue with the analysis
# setting plot size
fig, ax = plt.subplots(figsize = (8, 8))


# developing a correlation matrix object
df_corr = big5_scaled.corr(method = 'pearson').round(2)


# creating a correlation heatmap
sns.heatmap(df_corr,
            cmap = 'coolwarm',
            square = True,
            annot = True)
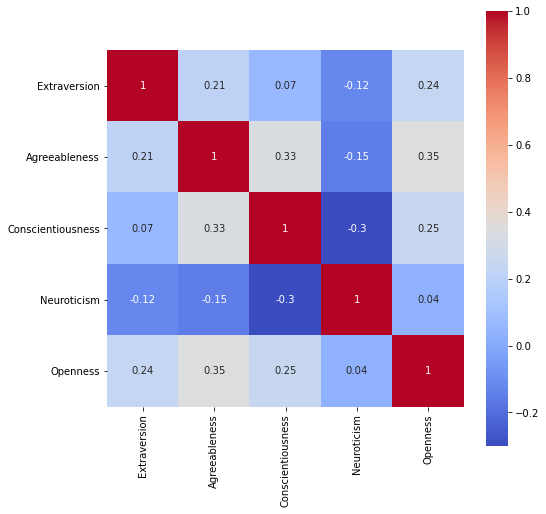
The correlation matrix show that we have variance between our groups since none of our groups show a correlation or 0.5 or more.
# INSTANTIATING a PCA object with no limit to principal components
pca = PCA(n_components = None,
          random_state = 802)


# FITTING and TRANSFORMING the scaled data
big5_pca = pca.fit_transform(big5_scaled)


# comparing dimensions of each DataFrame
print("Original shape:",  big5_scaled.shape)
print("PCA shape     :",  big5_pca.shape)
Original shape: (137, 5) PCA shape : (137, 5)
#Checking the variance between components
# component number counter
component_number = 0


# looping over each principal component
for variance in pca.explained_variance_ratio_:
    component_number += 1
    print(f"PC {component_number} : {variance.round(3)}")
PC 1 : 0.366 PC 2 : 0.222 PC 3 : 0.18 PC 4 : 0.124 PC 5 : 0.108
# printing the sum of all explained variance ratios

print(pca.explained_variance_ratio_.sum())
1.0
##Big5 PCA Model
#User defined function
########################################
# scree_plot
########################################
def scree_plot(pca_object, export = False):
    # building a scree plot

    # setting plot size
    fig, ax = plt.subplots(figsize=(10, 8))
    features = range(pca_object.n_components_)


    # developing a scree plot
    plt.plot(features,
             pca_object.explained_variance_ratio_,
             linewidth = 2,
             marker = 'o',
             markersize = 10,
             markeredgecolor = 'black',
             markerfacecolor = 'grey')


    # setting more plot options
    plt.title('Scree Plot')
    plt.xlabel('PCA feature')
    plt.ylabel('Explained Variance')
    plt.xticks(features)


    # displaying the plot
    plt.show()
#Creating a PCA plot to check the components
pca = PCA(n_components = None,
          random_state = 802)


# fitting and transforming the scaled data #
big5_pca = pca.fit_transform(big5_scaled)


# calling the scree_plot function
scree_plot(pca_object = pca)
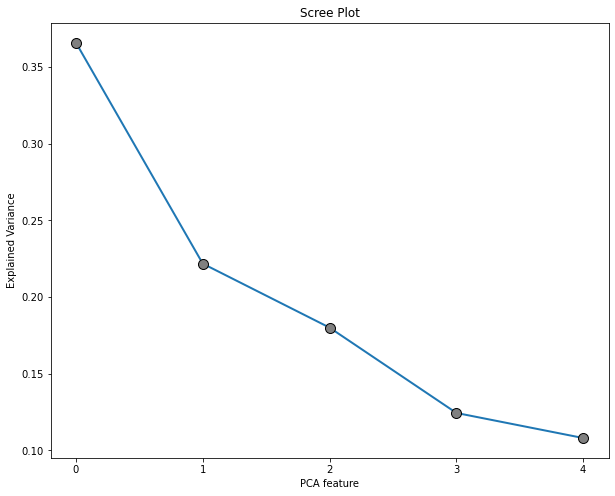 The elbow breaks at feature 2 so this means that we will have 3 components.
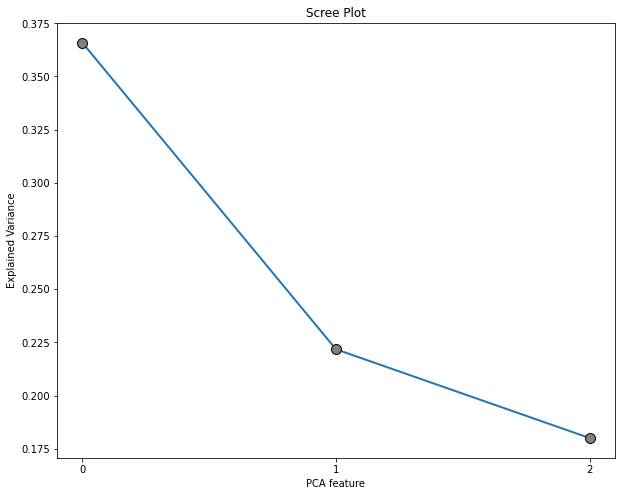
#Creating a new PCA plot only with the optimal components
pca_3 = PCA(n_components = 3,
          random_state = 802)


# fitting and transforming the scaled data #
big5_pca_3 = pca_3.fit_transform(big5_scaled)


# calling the scree_plot function
scree_plot(pca_object = pca_3)
# transposing pca components
factor_loadings_df = pd.DataFrame(pd.np.transpose(pca.components_))


# naming rows as original features
factor_loadings_df = factor_loadings_df.set_index(big5_scaled.columns)


# checking the result
print(factor_loadings_df)
0 1 2 3 4 Extraversion -0.361221 0.300114 0.815688 0.108408 -0.319925 Agreeableness -0.547304 0.113695 -0.192441 -0.805590 -0.039022 Conscientiousness -0.501491 -0.361670 -0.364976 0.404293 -0.566606 Neuroticism 0.305788 0.725207 -0.334629 -0.000356 -0.518258 Openness -0.474319 0.490178 -0.228989 0.419308 0.553617
# transposing pca components (pc = MAX)
factor_loadings = pd.DataFrame(pd.np.transpose(pca.components_))


# naming rows as original features
factor_loadings = factor_loadings.set_index(big5_scaled.columns)


### 3 component PCA model ###

# transposing pca components (pc = 3)
factor_loadings_3 = pd.DataFrame(pd.np.transpose(pca_3.components_))


# naming rows as original features
factor_loadings_3 = factor_loadings_3.set_index(big5_scaled.columns)


# checking the results
print(f"""
MAX Components Factor Loadings
------------------------------
{factor_loadings.round(2)}

""")
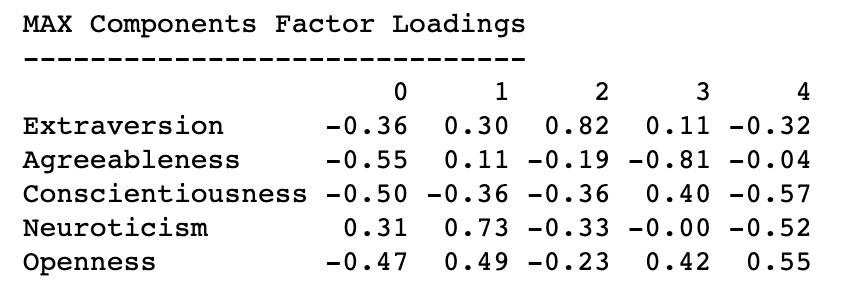
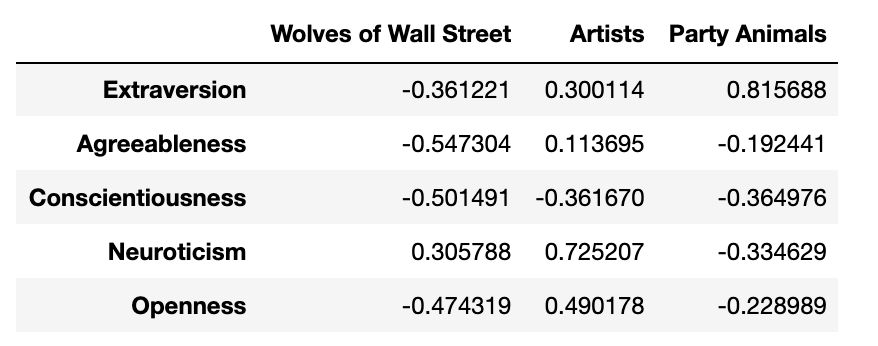
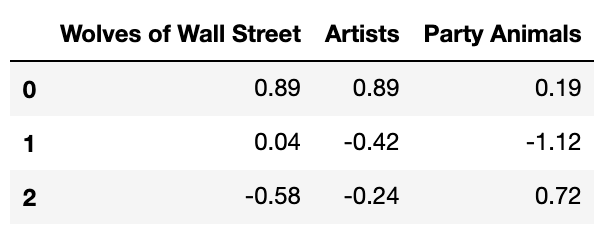
# naming each principal component
factor_loadings_3.columns = ['Wolves of Wall Street',
                              'Artists',
                              'Party Animals' ]
# checking the result
factor_loadings_3
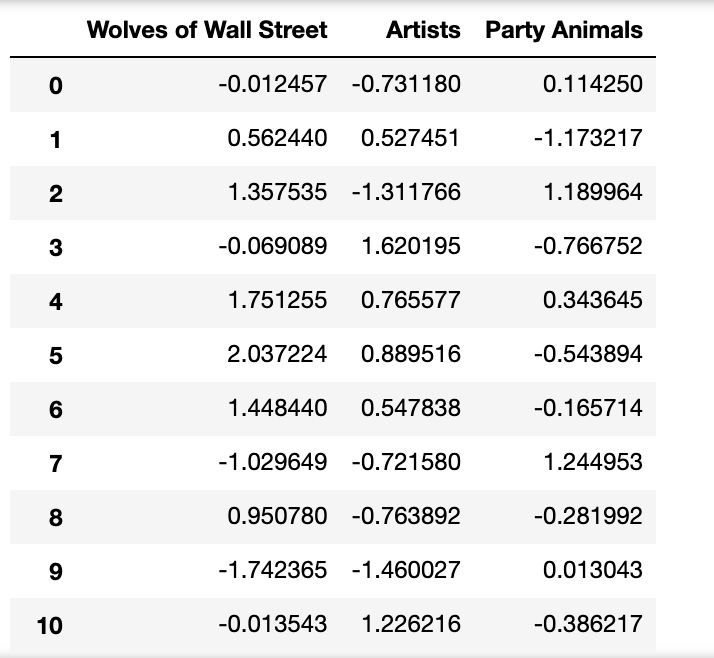
X_big5_reduced = pca_3.transform(big5_scaled)

# converting to a DataFrame
X_big5_df = pd.DataFrame(X_big5_reduced)

# Naming the columns #
X_big5_df.columns = ['Wolves of Wall Street',
                              'Artists',
                              'Party Animals']
# checking the results
X_big5_df
#Hult DNA We repeat the same process for the Hult DNA traits.
#Creating a subset for the Hult DNA analysis
df_hult_dna = team_df.drop(['survey_id_num', 'current_laptop','next_laptop',
                            'program','gender', 'nationality', 'ethnicity',
                     'life_of_party','concern_others','always_prepared','stressed_easily','rich_vocabulary',
                     'do_not_talk','int_people','leave_belong_around','relax_most_time','diff_und_abstract',
                     'conf_with_people','insult_people','attention_details','worry_things','vivind_immag',
                     'keep_background','symp_others','make_mess','seldon_feel_blue','uninterested_abstract_ideas',
                     'start_conversations','uncurious_about_people_problems','chores_done_right_away','easily_disturbed',
                     'have_excellent_ideas','have_little_to_say','soft_hearted','forget_to_place_back_inorder',
                     'get_upset_easily','bad_imagination','social_at_parties','not_intrested_in_others',
                     'like_order','frequent_mood_change','fast_learner','reticent_person','gives_time_for_others',
                     'shrik_my_duties','frequent_mood_swings','center_of_attention',
                      'feel_others_emotions','follows_schedule','mad_easily','spend_time_reflecting','quiet_with_strangers',
                     'make_people_feel_ease','exact_in_work','often_feel_blue','full_of_ideas','use_difficult_words','age_group',
                    'change_laptop','change_degree','change_age','change_gender','apple_target','country_mapped'    ],
                             axis = 1)
#Creating a list of variables that need to be inverted
hult_dna_inverted = ['dont_create_new_ideas',
'dont_sell_idea',
'cant_rally']
#Invert the number of some of the columns to match the description
hult_dna_df = df_hult_dna.copy()
for col in hult_dna_inverted:
    for i, cols in hult_dna_df.iterrows():
        if hult_dna_df.loc[i,col] == 1:
            hult_dna_df.loc[i,col] = 5
        elif hult_dna_df.loc[i,col] == 2:
            hult_dna_df.loc[i,col] = 4
        elif hult_dna_df.loc[i,col] == 4:
            hult_dna_df.loc[i,col] = 2
        elif hult_dna_df.loc[i,col] == 5:
            hult_dna_df.loc[i,col] = 1
#Grouping the columns that represent the thinking behavior
thinking_questions = ['answers_complex_situations','dont_create_new_ideas','self_awareness','growth_mindset',
'respond_effectively','takes_initiative']
hult_dna_df['Thinking'] = 0
for i in thinking_questions:
    hult_dna_df['Thinking'] = hult_dna_df['Thinking'] + hult_dna_df.loc[:,i]
#Grouping the columns that represent the communicating behavior
communicating_questions = ['encourage_open_discussions','listen_others','effect_negotiate','dont_sell_idea','build_coop_rel',
'work_diverse_cult']
hult_dna_df['Communicating'] = 0
for i in communicating_questions:
    hult_dna_df['Communicating'] = hult_dna_df['Communicating'] + hult_dna_df.loc[:,i]
#Grouping the columns that represent the team building behavior
team_building_questions = ['cant_rally','translate_ideas_to_plans',
'resolve_conflicts','seek_use_feedback','coach_for_perf_growth','drive_for_results']
hult_dna_df['Team_building'] = 0
for i in team_building_questions:
    hult_dna_df['Team_building'] = hult_dna_df['Team_building'] + hult_dna_df.loc[:,i]


# Creating new dataset
hult_dna_df = hult_dna_df[['Thinking',
                                       'Communicating',
                                       'Team_building']]
Hult DNA Scaling
# INSTANTIATING a StandardScaler() object
scaler = StandardScaler()


# FITTING the scaler with the data
scaler.fit(hult_dna_df)


# TRANSFORMING our data after fit
X_scaled = scaler.transform(hult_dna_df)


# converting scaled data into a DataFrame
hult_dna_scaled = pd.DataFrame(X_scaled)


# reattaching column names
hult_dna_scaled.columns = hult_dna_df.columns


# checking pre- and post-scaling variance
print(pd.np.var(hult_dna_df),'\n\n')
print(pd.np.var(hult_dna_scaled))
Thinking 10.619532 Communicating 8.760936 Team_building 9.935639 dtype: float64
Thinking 1.0 Communicating 1.0 Team_building 1.0 dtype: float64
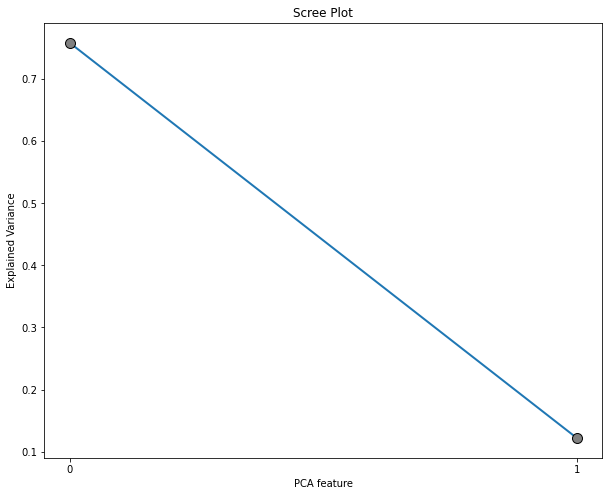
#Creating a PCA plot to show the optimal components
hult_2 = PCA(n_components = 2,
          random_state = 802)


# fitting and transforming the scaled data #
hult_dna_2 = hult_2.fit_transform(hult_dna_scaled)


# calling the scree_plot function
scree_plot(pca_object = hult_2)
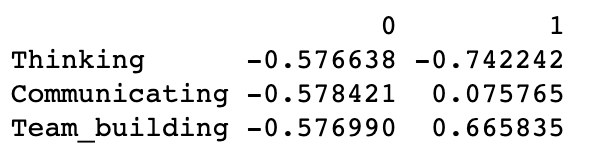
# transposing pca components
factor_loadings_df = pd.DataFrame(pd.np.transpose(hult_2.components_))


# naming rows as original features
factor_loadings_df = factor_loadings_df.set_index(hult_dna_scaled.columns)


# checking the result
print(factor_loadings_df)
# analyzing factor strengths per customer
X_hult_reduced = hult_2.transform(hult_dna_scaled)


# converting to a DataFrame
X_hult_df = pd.DataFrame(X_hult_reduced)

# Naming the columns #
X_hult_df.columns = ['Undeveloped',
                     'Geek']
# checking the results
X_hult_df

#User defined function
########################################
# inertia
########################################
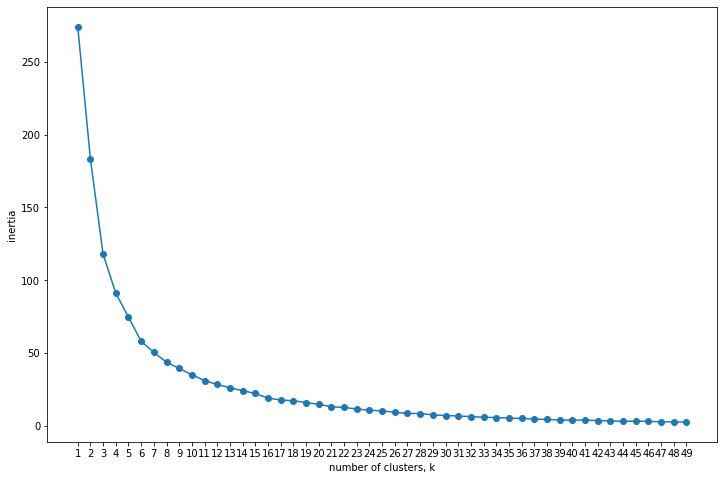
def interia_plot(data, max_clust = 50):
"""
PARAMETERS
----------
data : DataFrame, data from which to build clusters. Dataset should be scaled
max_clust : int, maximum of range for how many clusters to check interia, default 50
"""
ks = range(1, max_clust)
inertias = []
for k in ks:
# INSTANTIATING a kmeans object
model = KMeans(n_clusters = k)
# FITTING to the data
model.fit(data)
# append each inertia to the list of inertias
inertias.append(model.inertia_)
# plotting ks vs inertias
fig, ax = plt.subplots(figsize = (12, 8))
plt.plot(ks, inertias, '-o')
# labeling and displaying the plot
plt.xlabel('number of clusters, k')
plt.ylabel('inertia')
plt.xticks(ks)
plt.show()
########################################
# scree_plot
########################################
def scree_plot(pca_object, export = False):
# building a scree plot
# setting plot size
fig, ax = plt.subplots(figsize=(10, 8))
features = range(pca_object.n_components_)
# developing a scree plot
plt.plot(features,
pca_object.explained_variance_ratio_,
linewidth = 2,
marker = 'o',
markersize = 10,
markeredgecolor = 'black',
markerfacecolor = 'grey')
# setting more plot options
plt.title('Scree Plot')
plt.xlabel('PCA feature')
plt.ylabel('Explained Variance')
plt.xticks(features)
##Clustering Big5
# INSTANTIATING a StandardScaler() object
scaler = StandardScaler()


# FITTING the scaler with the data
scaler.fit(X_big5_df)


# TRANSFORMING our data after fit
X_big5_scaled_pca = scaler.transform(X_big5_df)


# converting scaled data into a DataFrame
X_big5_scaled = pd.DataFrame(X_big5_scaled_pca)


# reattaching column names
X_big5_scaled.columns = ['Wolves of Wall Street',                 # No Vegan, No Vege, No Indian
                      'Artists',          # No Med, No ME, No Wine
                      'Party Animals'] # Med, No Wine


# checking pre- and post-scaling variance
print(pd.np.var(X_big5_df), '\n\n')
print(pd.np.var(X_big5_scaled))
Wolves of Wall Street 1.829398 Artists 1.108742 Party Animals 0.900072 dtype: float64
Wolves of Wall Street 1.0 Artists 1.0 Party Animals 1.0 dtype: float64
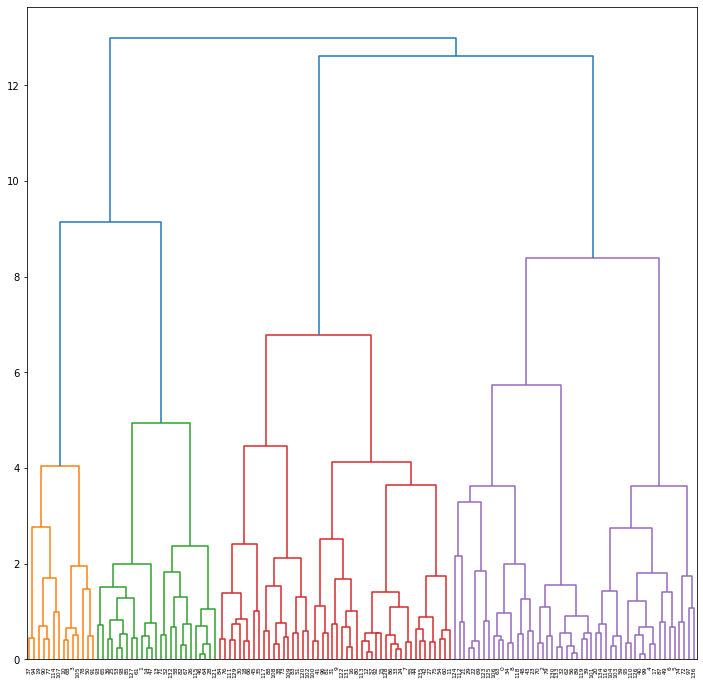
# grouping data based on Ward distance for 5p
standard_mergings_ward = linkage(y = X_big5_scaled,
                                 method = 'ward',
                                 optimal_ordering = True)


# setting plot size
fig, ax = plt.subplots(figsize=(12, 12))

# developing a dendrogram
dendrogram(Z = standard_mergings_ward,
           leaf_rotation = 90,
           leaf_font_size = 6)


# displaying the plot
plt.show()
# calling the inertia_plot() function
interia_plot(data = X_big5_scaled)
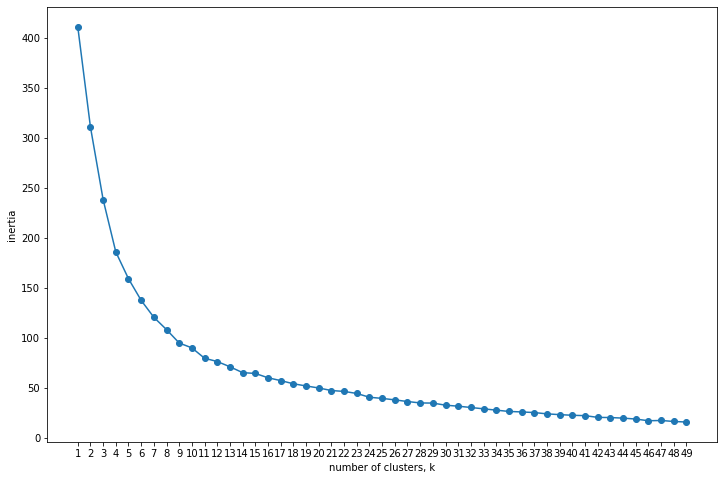
# INSTANTIATING a k-Means object with clusters
big5_k_pca = KMeans(n_clusters   = 3,
                         random_state = 219)


# fitting the object to the data
big5_k_pca.fit(X_big5_scaled)


# converting the clusters to a DataFrame
big5_kmeans_pca = pd.DataFrame({'Cluster': big5_k_pca.labels_})
# storing cluster centers 5p
centroids_pca_big5 = big5_k_pca.cluster_centers_


# converting cluster centers into a DataFrame
centroids_pca_df_big5 = pd.DataFrame(centroids_pca_big5)


# renaming principal components
centroids_pca_df_big5.columns = ['Wolves of Wall Street',                 # No Vegan, No Vege, No Indian
                      'Artists',          # No Med, No ME, No Wine
                      'Party Animals']


# checking results (clusters = rows, pc = columns)
centroids_pca_df_big5.round(2)
# concatenating cluster memberships with principal components 5p
clst_pca_df_big5 = pd.concat([big5_kmeans_pca,
                         X_big5_scaled],
                         axis = 1)


# checking results
#clst_pca_df_5p


# concatenating demographic information with pca-clusters
final_pca_clust_df_big5 = pd.concat([team_df.loc[ : , ['current_laptop','next_laptop','apple_target',
                            'program','gender', 'nationality', 'ethnicity','change_laptop','country_mapped','age_group']],
                                clst_pca_df_big5],
                                axis = 1)

# checking the results
#final_pca_clust_df_big5.head(n = 10)
##Clustering Hult DNA
# INSTANTIATING a StandardScaler() object
scaler = StandardScaler()


# FITTING the scaler with the data
scaler.fit(X_hult_df)


# TRANSFORMING our data after fit
X_hult_scaled_pca = scaler.transform(X_hult_df)


# converting scaled data into a DataFrame
X_hult_scaled = pd.DataFrame(X_hult_scaled_pca)


# reattaching column names
X_hult_scaled.columns = ['Undeveloped','Geek'] # Med, No Wine


# checking pre- and post-scaling variance
print(pd.np.var(X_hult_df), '\n\n')
print(pd.np.var(X_hult_scaled))
Undeveloped 2.275499 Geek 0.365870 dtype: float64
Undeveloped 1.0 Geek 1.0 dtype: float64
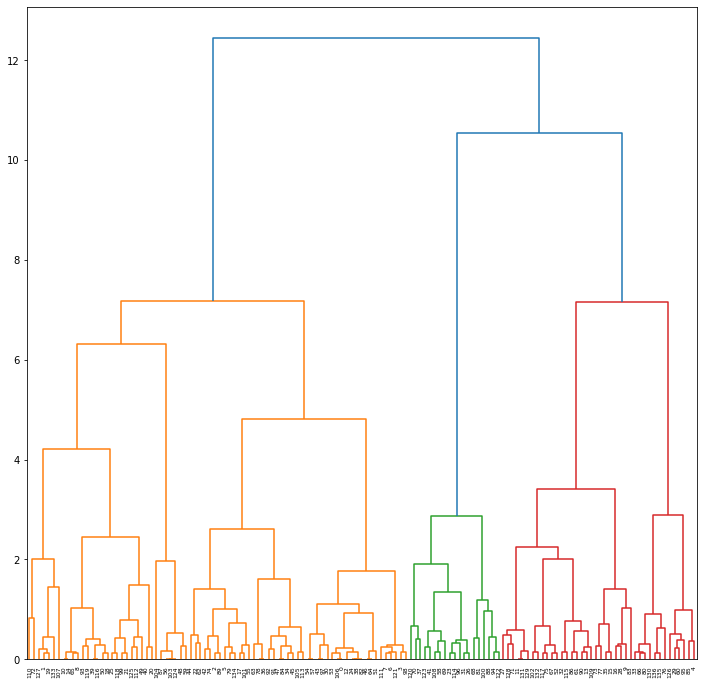
# grouping data based on Ward distance for 5p
standard_mergings_ward = linkage(y = X_hult_scaled,
                                 method = 'ward',
                                 optimal_ordering = True)


# setting plot size
fig, ax = plt.subplots(figsize=(12, 12))

# developing a dendrogram
dendrogram(Z = standard_mergings_ward,
           leaf_rotation = 90,
           leaf_font_size = 6)


# displaying the plot
plt.show()
# calling the inertia_plot() function
interia_plot(data = X_hult_scaled)
# INSTANTIATING a k-Means object with clusters
hult_k_pca = KMeans(n_clusters   = 3,
                         random_state = 219)


# fitting the object to the data
hult_k_pca.fit(X_hult_scaled)


# converting the clusters to a DataFrame
hult_kmeans_pca = pd.DataFrame({'Cluster': hult_k_pca.labels_})


# checking the results
print(hult_kmeans_pca.iloc[: , 0].value_counts())
1 53 0 43 2 41
Analysis Results
Currently the population of our survey is evenly split between MacBook (50.4%) and Windows (49.6%). However, the population is changing its preferences. Potential MacBook users are growing 5.8% and Windows users are shrinking 8.7%. This indicates a loss of interest in Windows laptops given the same price. Based on our analysis and clustering we can provide the following insights:
Main Insights
Insight #1 Artistic people in cluster zero strongly prefer MacBook over Windows. They also reported a strong interest in keeping a MacBook as their next laptop. In grouping cluster zero based on nationality, gender, age and program for further analysis we discovered that people are mostly men originally from North America between 21 and 29 years old and pursuing a one year business analytics program.
Recommendation We strongly suggest to the manager to implement a targeted discount program for first year MSBA students for marketing analytics and design software running on Mac. Mac has great software programs for designing, video and picture editing and it is also recognized for innovation, imagination, creation of new ideas. Since we see that these are artistic people, the company should create a package offering Photoshop, Inshop Pro, Splice Pro more of these programs used for editing, that they can offer universities and the univerisity can offer this package for free to students buying a Macbook as their next laptop.
Insight #2 Based on the big five trait, we see that there is customer gain specifically in cluster 2 party animals with no customer loss within that group, indicating promising marketing opportunities. For the party animals in cluster 2, they are mostly Europeans in their twenties and thirties and the likelihood of being male is slightly more than being female. Their programs are mostly in one year business analytics and none in DD (MBA & disruptive innovation).
Based on hult DNA, there is customer gain specifically in cluster 1 geek with no customer loss as well, which would be another target group for great marketing opportunities. Cluster 1 Geeks are most likely African Americans in their forties from Africa and South America. There is also slightly more likelihood of being male than female. Their programs are mostly in one year business analytics program.
Both party animals and geeks are good with people. Party animals are extroverted, who tend to be enthusiastic, action-oriented and have a pronounced engagement with the external world. Geeks excel at team building and they are results- driven.
Recommendation Based on the insights, in order to ensure their potential new customers, Apple should design their marketing brand image to emphasize on its contribution to human connections. Not only in demonstrating more functions in communicating, but also in increasing more smiling faces and scenes of group work and social gatherings in the advertisement to attract the appealing crowd. Beats by Dr.Dre was one way for them to market music and target some other type of customer, they also created Apple music offering a student discount. The same way they can offer a discount to Hult students, if working with Hult, or a student discount when showing a valid student id when they purchase a Macbook they get Beats by Dr. Dre or a speaker, since a speaker is a more social object.
Insight #3 We noticed a consumer loss from the Underdeveloped group. This group of people are from the age groups of 20’s and 30’s, doing the one year business analytics, and a high volume of them are from South America and an even split between male and female. Underdeveloped students with these characteristics when finding the smallest error, they will look for something better or something of their convenience. Adding to this, many students that come from those countries might be on a student/bank loan.
Recommendation To support those students and to make them stay loyal with Apple, the company should offer a one year guarantee on their products providing full coverage in all of the students Apple products. One thing that is very common from the Apple products is that the screen from the Iphone keeps breaking. Apple should think about expanding their customer support and adding a screen repair or replacement. As well as, allowing to trade every Apple product for discounts when buying a Macbook, not necessarily trade another Macbook but also being able to trade your Iphone or Ipad for discounts on the next purchase for a Macbook.To support those students and to make them stay loyal with Apple, the company should offer a one year guarantee on their products providing full coverage in all of the students Apple products. One thing that is very common from the Apple products is that the screen from the Iphone keeps breaking. Apple should think about expanding their customer support and adding a screen repair or replacement. As well as, allowing to trade every Apple product for discounts when buying a Macbook, not necessarily trade another Macbook but also being able to trade your Iphone or Ipad for discounts on the next purchase for a Macbook.
Overall Conclusion
Apple is a company that when having one of their products you do not want to buy any other brand. Regarding this situation, the analysis was based primarily on business analytics students that need a programming computer or a software that allows them to work properly. Even with that, Apple can be compatible with many softwares and it is very user friendly. If Apple wants to increase their sales of Macbooks, they will want to follow our previous recommendations because they are based on different behaviors so each recommendation fits the different types of people. An overall recommendation for Apple is that they have a range of multiple products that they can use on their favor, creating packages, discounts, offering another free product is always been a way to attract people to buy a product.
Sources
Crowe Associates. (2019, August 15). The “big 5” Personality traits | Crowe Associates. Crowe Associates | Committed to People Development. Retrieved from http://www.crowe-associates.co.uk/coaching-tools/the-big-5-personality-traits/
Hult DNA Development Guide (2016). Retrieved from https://www.coursehero.com/file/45126181/Hult-DNA-Development-Guide-2016-17pdf/